by
Sui Tan
| Aug 03, 2017
Cities and counties should give themselves a pat on the back with the passage of Senate Bill 1 (SB1) in April. This bill will raise gas taxes and vehicle fees by $5.2 billion a year to pay for California’s crumbling roads, highways, and bridges for the next decade. Cities and counties will receive $1.5 billion annually to fix local streets and roads. Since 2008, cities and counties, through the “California Statewide Local Streets and Roads Needs Assessment” initiative (www.SaveCaliforniaStreets.org), have been documenting their maintenance needs for local streets and roads. The $78 billion shortfall over the next decade, as cited in SB1, was a result of the needs assessment study. Unfortunately, SB1 only covers 20% of the shortfall.
Performance, Accountability, and Transparency
At the state level SB1 holds Caltrans accountable for the efficient use of funding by requiring them to adopt a transportation asset management plan. But no such requirement is needed for cities and counties. However, this is not to say that asset management isn’t important for cities and counties, nor that cities and counties can freely use the funding as they see fit. On the contrary, they are still accountable for the efficient use of funding in the form of their performance and transparency to the motoring public. So if your agency doesn’t have a pavement management program as part of your transportation asset management, you should be making it a priority now.
Performance Measures
For the majority of the cities and counties that deploy a pavement management system, there are a few performance measures, or ‘key performance indicators’ (KPI), that can help track the effectiveness of pavement preservation efforts from the use of SB1 funds. I’ll talk more about KPI’s in a future issue, but for now, let’s focus on the effectiveness of pavement preservation efforts.
You need look no further than your pavement management system, which tracks maintenance and rehabilitation history. You may start with finding out what is the recommended percentage for preventive maintenance when your network is in the ‘state of good repair’ (SGR PM%). This will be the ultimate goal of pavement managers - to be able to sustain their pavement asset perpetually. Then you will calculate the pavement maintenance work that your agency has completed in the last 3 years. To get credit for preventive maintenance, based on best management practice, you will have to apply a treatment to arterial and collector streets with pavement condition index (PCI) above 70, and residential streets and local roads with PCI’s above 60. Once those road segments have been identified, you will sum them up for the year and compare their cost to the entire maintenance expenditure. This is your preventive maintenance percentage (PM%).

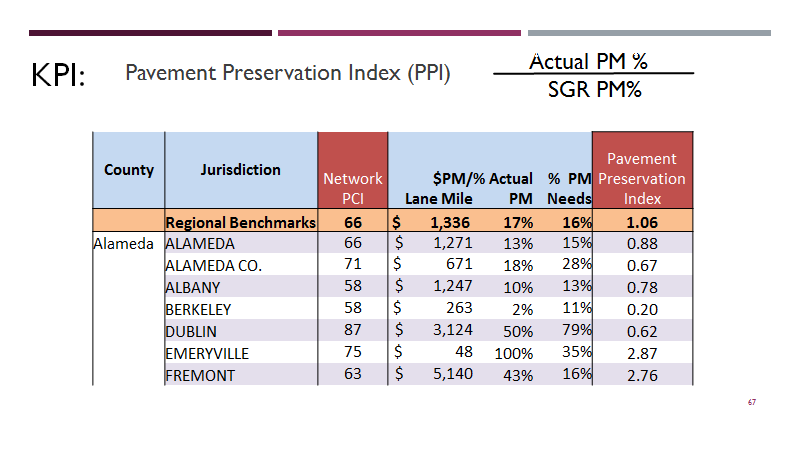
You will need to develop at least 3 years of history, averaging them to arrive at a reasonable actual PM%. When you compare this value to the SGR PM%, you get the effectiveness of your pavement maintenance and preservation effort, which is called the Pavement Preservation Index (PPI).
In the MTC region, using our StreetSaver® pavement management system, we are able to track the effectiveness of pavement preservation programs through the use of PPI values. As shown in the figure below, the benchmark PPI for the region in 2012 was 1.06. This means that overall, the Bay Area’s cities and counties are generally subscribing to pavement preservation. For example, within Alameda County, it shows there are agencies who are strong advocates for pavement preservation and others who are not. We are developing other indicators, i.e., KPI’s, that will be available at the end of the year when StreetSaver® switches to a full web-based version. Stay tuned!